Home Stock Market

Stock Market

Everything to know about the OTC
Everything to know about the OTC

What is the OTC Exchange?


• The OTC or over-the-counter exchange is a marketplace to trade financial instruments, such as stocks, derivatives, commodities or bonds directly between a buyer and seller. The OTC exchange is contrasted with exchange trading marketplaces, such as the New York Stock Exchange, which will affirm trades via a facility constructed for the purpose of trading.
• The two most common trading networks of the OTC markets are the Pink Sheets and the Over the Counter Bulletin Board. The OTCBB operates as an electronic medium for broker dealers by displaying real-time quotes, prices and volume for all OTC securities. The OTCBB is regulated by the Financial Industry Regulatory Authority and requires all securities listed on the market to file reports with the SEC or the respective regulator for its industry.
• The Pink Sheets, which is published in a private manner by its parent company, also utilizes an electronic quotation system for broker-dealers. The Pink Sheets; however, do not require companies to meet any formal requirements for listing; those companies on the Pink Sheets are typically thinly traded and viewed as speculative investment opportunities. 
• In the United States, all OTC trading, primarily in stock, is carried out by market makers that created the markets in the Pink Sheets or OTCBB securities using only inter-dealer quotation services. An OTC stock is not typically listed nor traded on any stock exchange; however, exchange listed stocks may be traded OTC on the third market. Although stocks quoted on the OTCBB must formally comply with regulations and laws instituted by the United States Securities and Exchange Commission, other OTC stock, such as those categorized as Pink Sheet securities, are free from reporting requirements. Furthermore, those stocks categorized as OTCQX securities must meet alternative disclosure regulations through the Pink OTC marketplace. 
• Unlike the conventional stock exchanges, such as the NYSE or the Toronto Stock Exchange, the OTC market possesses no physical location. Instead, all OTC items are traded over technological mediums; a network of broker-dealers will facilitate the buying and selling orders of investors. A company may choose to issue securities in the OTC marketplace to avoid listing requirements or because the respective security is attached with increased volatility.  
What are OTC Contracts?
• A stock trading over the counter will be attached with a bilateral contract; these OTC contracts require that two parties agree on how a specific trade or agreement is to be affirmed in the future. The OTC contract is typically spawned from an investment bank then offered directly to the institution’s client base. Common examples of such OTC contracts are forwards and swaps; these contracts are very common for investment banks and option traders. 
• The majority of OTC contracts are executed and affirmed by computer or telephone; for derivatives, these agreements are typically governed by various regulations, which are formally instituted by an International Swaps and Derivatives Association Agreement.   

Going Down: Summary of a Bear Market

Going Down: Summary of a Bear Market

Market Trends Explained:


• A market trend refers to the tendency of a financial market, such as a stock market, to move in a particular direction over time. Market trends are classified only in long time frames, medium time frames and lasting short times—each time frame has a specific designation (secular, secondary and primary market trends). 
• Understanding the concept of market trends is vital, especially to traders, who utilize momentum and investor confidence when attempting to earn a profit with quick stock trades. A trader will identify market trends using technical analysis; this concept characterizes market trends as predictable price fluctuations within the market place in relation to support and resistance levels, which vary over time. 
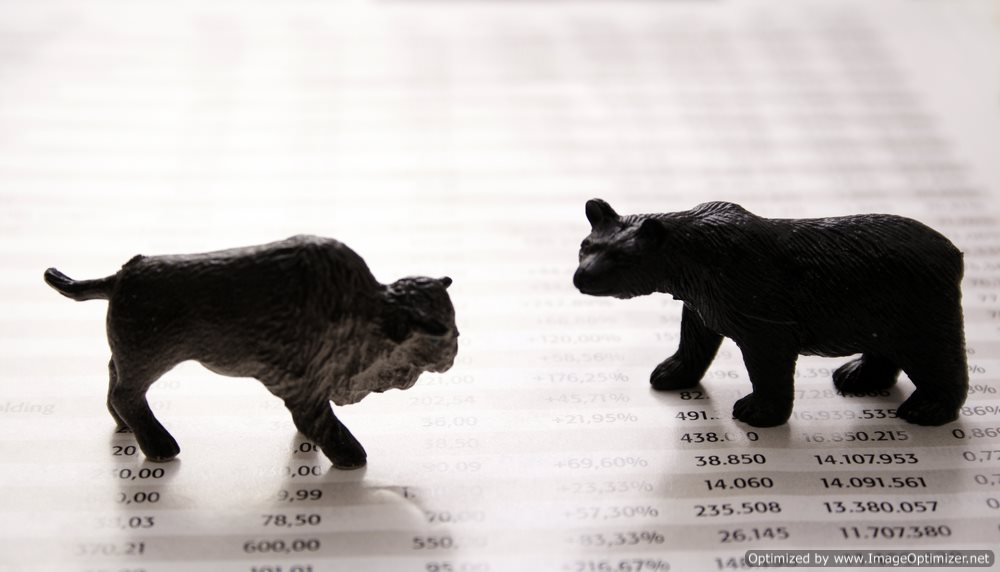
• A bull and bear market is common terms, used to describe upward and downward market trends respectively. These terms can be used to describe a marketplace as a whole or individual sectors and securities. 
Types of Market Trends:
• A market trend, as stated before, is somewhat of a broad term that is used to denote the fluctuation of a market in one direction or the other over an established period of time. For instance, a secular market trend refers to any long-term trend that lasts 5 to 25 years and consists of a series of smaller or primary trends.
• Due to the fact that a secular trend measures such a long time frame, a secular bear market may consist of numerous smaller bull markets; that being said, if the trend is bearish over that significant of a time frame, the market will undoubtedly have more and larger bear markets than bulls. In a secular bear market, the prevailing trend is downward moving while in a secular bull market the trend is swinging upwards– the United States experienced a secular bull market during the early 80s up until 2000, even with brief recessions in 1987 and the dot.com collapse in 2000. 
• A secondary market trend signifies a short-term change in price direction within a primary period; the duration lasts from a few weeks to a few months. A common type of secondary market trend is known as a correction, where a short term price decline b/t 5 to 20% forces the market downwards, but not into a recession. By contrast, another type of secondary market trend is known as a rally, which consists of a market price increase of 10 to 20%. The last type of market trend is the primary market trend, which has broad support throughout the entire market and lasts for a year or more. 
What is a Bear Market?
• A bear market signifies a general decline in the stock market over a period of time. A bear market is a transition from high investor confidence or optimism to widespread speculation and fear that the market will continue to dip. 
• Although many investors and institutions agree that there is no exact definition, in regards to set percentages of a bear market, the overwhelming opinion of the finance sector is that a bull market occurs when a price decline of 20% or more is experiences over at least a two-month timeframe. A bear market may form for a number of reasons, the most common of which being, the bursting of bubbles (such as the dotcom bubble or a real estate collapse), poor macro-economic numbers , overvaluations of the market place or cataclysmic events, such as prolonged natural disasters or terrorist attacks. 

Going Up: What’s a Bull Market?

Going Up: What's a Bull Market?

What does a Market Trend mean?


• A market trend refers to the tendency of a financial market, such as a stock market, to move in a particular direction over time. Market trends are classified only in long time frames, medium time frames and lasting short times.  Understanding the concept of market trends is vital, especially to traders, who utilize momentum and investor confidence when trying to earn a profit with quick stock trades. 
• A trader will identify market trends using technical analysis; this concept characterizes market trends as predictable price fluctuations within the market place in relation to support and resistance levels, which vary over time. A bear and bull market are common terms–ones that we hear almost daily on financial talk shows—used to describe downward and upward market trends respectively. These terms can be used to describe a marketplace as a whole or individual sectors and securities. 
Types of Market Trends:


• Market trend, as stated before, is somewhat of a broad term that is used to denote the fluctuation of a market in one direction or the other over an established period of time. For instance, a secular market trend refers to any long-term trend that lasts 5 to 25 years and consists of a series of smaller or primary trends.
• Due to the fact that the secular trend measures such a long time frame, a secular bear market may consist of numerous smaller bull markets; that being said, if the trend is bearish over that significant of a time, the market will undoubtedly have more and larger bear markets than bulls. In a secular bull market, the prevailing trend is upward moving; the United States experienced a secular bull market during the early 80s up until 2000, even with brief recessions in 1987 and the dot.com collapse in 2000. 
• A secondary market trend signifies a short-term change in price direction within a primary period; the duration lasts from a few weeks to a few months. A common type of secondary market trend is known as a correction, where a short term price decline b/t 5 to 20% forces the market downwards, but not into a recession. By contrast, another type of secondary market trend is known as a rally, which consists of a market price increase of 10 to 20%. The last type of market trend is the primary market trend, which has broad support throughout the entire market and lasts for a year or more.
 
What is a Bull Market?
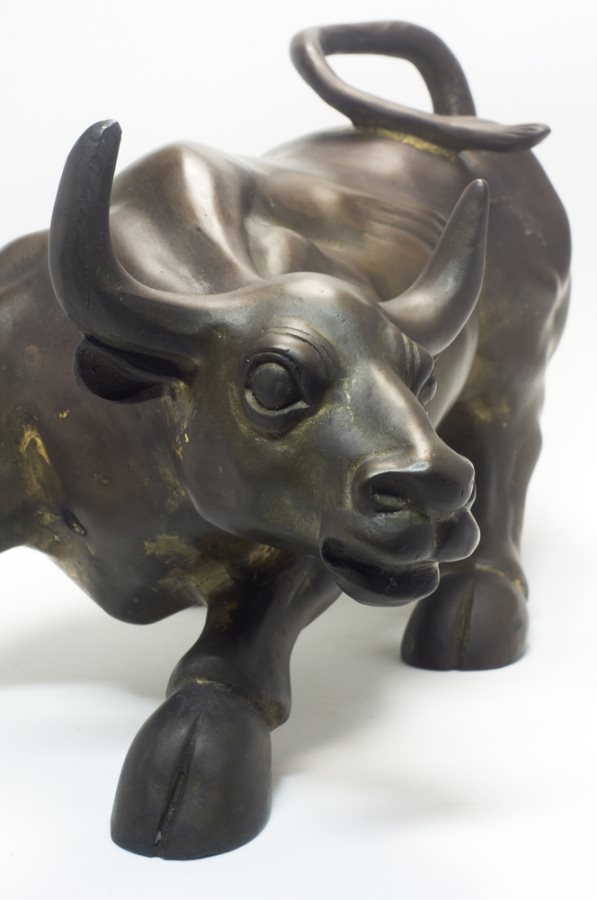
• A bull market, as stated above, refers to a prolonged period of increasing capital gains and rising stock prices. A bull market typically occurs for a number of reasons, including increased investor confidence and increased investing in anticipation of future profit or stock price increases. A bull market will form for a number of reasons and the majority of bullish trends will begin before the economy as a whole shows a clear sign of recovery or strengthening. 

Hong Kong Stock Exchange: What you Should Know

Hong Kong Stock Exchange: What you Should Know

What is the Hong Kong Stock Exchange?


• The Hong Kong Stock Exchange (Symbol: HKEX) is the third largest stock exchange, in regards market to capitalization, ranking only behind the Tokyo Stock Exchange and the Shanghai Stock Exchange. As of January of 2011, the Hong Kong Stock Exchange has over 1,400 listed companies that possess a combined market capitalization of $2.7 trillion. 
Brief History of the Hong Kong Stock Exchange:


• The history of the Hong Kong Stock Exchange began formally in 1891, though a series of informal securities exchanges can be dated back to the early 1860s. The Hong Kong Stock Exchange has primarily been the dominant exchange for Hong Kong despite existing alongside numbers other exchanges throughout its history. Following a series of complex mergers and acquisitions, the Hong Kong Stock Exchange remains the core marketplace for the trading of various companies. 
Trading Hours and Characteristics of the Hong Kong Stock Exchange:
• The trading day in Hong Kong opens, in a pre-auction session, at 9:00 to 9:30 am. Following the preliminary auction process, the morning trading session lasts from 9:30 am to 12:00 pm. From 12:00 pm to 1:30 pm the market utilizes an extended morning session which is referred to as the lunch break. Continuous trading then proceeds until 4:00 pm. The opening price of a security listed on the Hong Kong Stock Exchange is first reported at 9:20 am; the closing price is then reported as the median of various price snapshots at 4:00 pm.
 
• The Hong Kong Stock Exchange utilizes a computer-assisted trading system known as the “Automatic Order Matching and Execution System”. It is considered normal for even well-known stocks listed on the Hong Kong Stock Exchange to trade at prices that correspond to less than $4 a share. A Hong Kong stock would not be labeled as a cheap or penny stock unless its price was less than roughly $.50 cents per share. 
• Each individual stock listed on the Hong Kong Stock Exchange possesses its own board lot size; online brokers will typically display these slots along with the price when an investor receives a quote. All purchases that are ordered not in multiples of the board lot size are affirmed in a separate market known as the “odd lot market.” Furthermore, the Hong Kong Stock Exchange enforces a close-in-price rule for limit orders, which must be placed within 24 ticks of the current price. Brokers may impose stricter rules that require limit orders to be placed within 10 ticks of the current price listing. 
What are some of the larger stocks listed on the Hong Kong Stock Exchange?


The largest stocks, in terms of market capitalization, listed on the Hong Kong Stock Exchange are as follows:


PetroChina
Industrial & Commercial Bank of China
China Mobile
China Construction Bank
HSBC Holdings
Bank of China
Sinopec Corp
China Life Insurance
Chine Shenhua Energy
CNOOC
Standard Chartered

London Stock Exchange: An Overview

London Stock Exchange: An Overview

What is the London Stock Exchange?


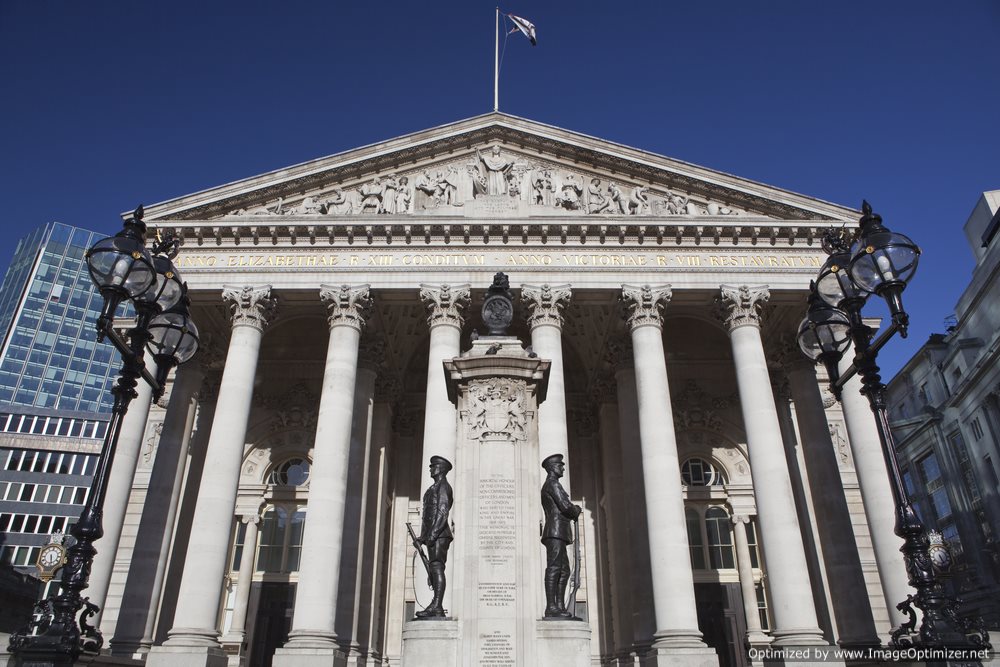
• The London Stock Exchange is a marketplace where investors come together to buy and sell stocks and other investment securities. Located in London, England the London Stock Exchange, as of December of 2010, has a market capitalization of roughly $3.65 U.S. dollars—a figure that makes the London Stock Exchange the fourth-largest exchange in the world. 
History of the London Stock Exchange:


• The premise of the London Stock Exchange and investing in general arose when the need to finance war efforts and voyages became paramount. To reach China via the White and sea and for the East India Company to travel to India and east, the trading of stocks was utilized to spark business and fuel the economy. Unable to finance such lofty journeys in the private sector, English companies raised money by selling shares to merchants and wealthy citizens, giving these individuals a right to a portion of any profits they eventually made. 
• This idea of investing in a company quickly caught on; by 1695, England featured 140 joint-stock companies. During this time, the trading was centered in the City’s Change Alley, where investors and corporate executives would gather in coffee shops to exchange and affirm share purchases. To streamline the growing the operation the London Stock Exchange evolved and moved to its current premise, satiated in Paternoster Square near St. Paul’s Cathedral in downtown London. 
• In December of 2005, the London Stock Exchange rejected a 1.6 billion Euro takeover offered from the Macquarie Bank. Shortly after this rejection, the London Stock Exchange received an unsolicited offer from NASDAQ, which valued the London Stock Exchange at approximately 2.4 billion Euros. This offer (and additional offers by NASDAQ in the upcoming years), although significantly higher, was rejected yet again. That being said, a few weeks after the second rejection for a purchase, the London Stock Exchange’s largest investor sold 35.4 million shares at 11.75 pounds per share to Ameriprise Financial. NASDAQ also purchased a large chunk of the London Stock Exchange following this transaction; the London Stock Exchange was always a target for purchase in order to limit the Exchange’s strategic flexibility. 
• In February of 2011, the London Stock Exchange announced that they had agreed in principal to merge with the TMX group—the parent company of the Toronto Stock Exchange. This proposed deal would create an entity with a market capitalization of listed companies equal to nearly 4 trillion U.S. Dollars.
Hours of Operation and Products offered by the London Stock Exchange:
• The London Stock Exchange has four primary areas: Equity Markets, Trading Services, Information Services and Derivatives. The London Stock Exchange’s normal trading hours are from 8:00 am to 4:30 pm every day of the week except holidays and weekends declared by the Exchange in advance. As of December of 2010, the London Stock Exchange is home to 2,713 companies.

Toronto Stock Exchange: Brief Overview

Toronto Stock Exchange: Brief Overview

What is the Toronto Stock Exchange?


• The Toronto Stock Exchange, based on market capitalization, is the largest stock exchange in Canada, the third largest in North America and the seventh largest in the world. The Toronto Stock Exchange is owned by the TMX Group; the exchange is operated as a subsidiary of the company.
• The Toronto Stock Exchange is home to a number of companies from Canada, the United States, Europe and other nations throughout the world. In addition to conventional stock listings, the Exchange features a number of exchange traded funds, investment trusts, investment funds and split share corporations. Furthermore, the Toronto Stock Exchange is regarded as the global leader in the mining, oil and gas sector—more mining and oil & gas companies are listed on the Toronto Stock Exchange than on any other market in the world. 
Brief History of the Toronto Stock Exchange:
• The Toronto Stock Exchange was informally created on October 25, 1861, when twenty-four business men gathered at Masonic Hall to officially create a marketplace, where they can buy and sell rights to corporations. When the meeting place grew in size, the exchange was formally incorporated by the Legislative Assembly of Ontario in 1878.
• Following government recognition, the Toronto Stock Exchange exponentially grew in size and the number of shares traded. In 1934, the Exchange merged with the Standard Stock and Mining Exchange—a key competitor. The merger kept the name, the Toronto Stock Exchange, and an automated trading system was incorporated, to be used for the quotation of poorly liquid equities, in 1977. Once the Toronto Stock Exchange incorporated CATS (Computer Assisted Trading System) the market shut down its trading floor, making the Toronto Stock Exchange the second largest stock exchange on the continent to operate solely in a virtual trading environment. 
• In 2000, the Toronto Stock Exchange officially became a for-profit company; 11 years later, in February of 2011, the London Stock Exchange merged with the TMX Group to create a combined entity that featured a market capitalization of nearly $6 trillion dollars. This deal; however, has not been finalized as numerous rivals are offering bids in hopes of blocking the merger. 
Hours of Operation and Companies Listed:
• The Toronto Stock Exchange operates under a normal trading session from 9:30 am to 4:00 pm ET; the market has post-market trading sessions that go from 4:15 pm to 5:00 pm ET on all days of the week except weekends and holidays declared by the Exchange. 
• As of January of 2011, the Toronto Stock Exchange has 1,498 companies listed with a combined market capitalization of over $2 trillion dollars. The Toronto Stock Exchange lists all of Canada’s premiere commercial banks, including the Bank of Montreal, Bank of Nova Scotia, Royal Bank of Canada, the Toronto-Dominion Bank and CIBC. In addition to financials, the Toronto Stock Exchange lists a number of primary energy companies including: Husky Energy Inc., the Cameco Corporation, Canadian Natural Resources Ltd, Canadian Oil Sands Trust and the EnCana Corporation. 

Guide to the Nikkei 225

Guide to the Nikkei 225

What is the Nikkei 225?

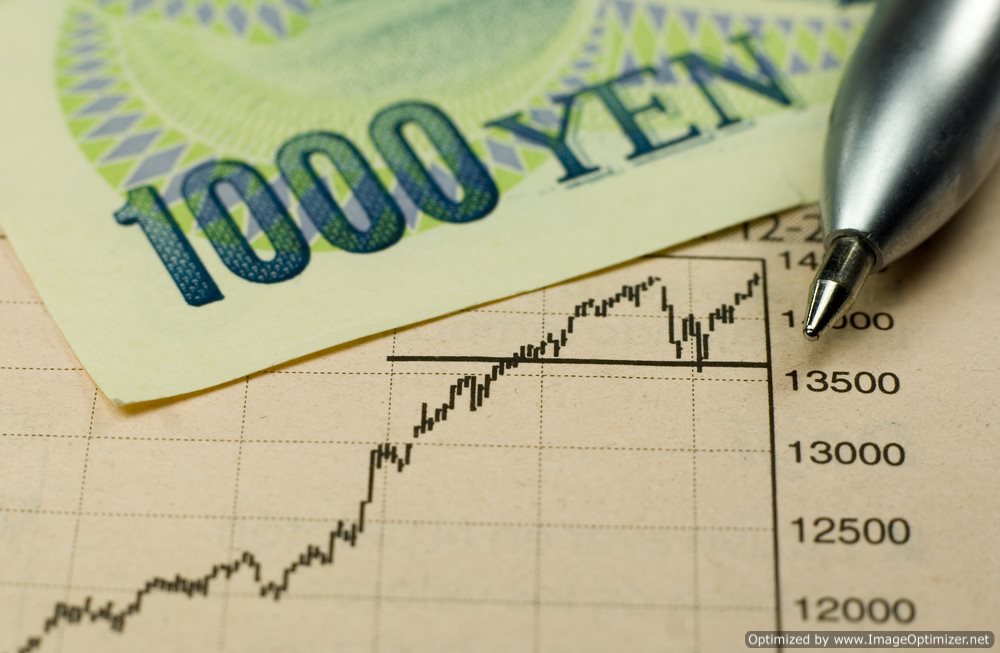
• The Nikkei 225, more commonly referred to as simply the Nikkei, is a popular stock market index for the Tokyo Stock Exchange. The Nikkei 225 has been calculated by a large newspaper in Tokyo since 1950; it is a price-weighted average that is made up of various components, which are computed annually.  Like the Dow Jon Industrial Average in the United States, the Nikkei is a composite index that is regarded as the most widely quoted average of Japanese equities. As an index, the Nikkei is used to gauge the markets strength, by placing some of the larger or more dominant industry leaders within the index. 
• The Nikkei 225 average, which is updated every 15 seconds during trading session, has sharply deviated from the generic model of stock averages, which grow at a steady exponential rate. The Nikkei 225 hit a high on December 28, 1989, during the peak of the Japanese real estate and asset bubble—the Nikkei, during this time of great expansion grew six fold during the 1980s. That being said, because of the bursting of the proverbial bubble, the Nikkei 225 has lost nearly all its gains—the Index closed at 7,054.98 in March of 2009, an 82% decline since its peak twenty years prior.
How are Stocks weighted on the Nikkei 225?
• The Nikkei 225 employs an equal weighting system for stocks based on a par value of 50 yen per share. Events, such as stock splits or additions and removals of stocks listed on the index will affect this weighting system and the respective divisor. That being said, the Nikkei 225 is designed to reflect, as stated before, the health of the overall market, so no specific weighting of industries is accounted for in the index.
 
• All stocks on the Nikkei are reviewed annually; announcements of review results are made every September. Changes to the Nikkei, if required, are made at the beginning of each October; changes may also take place if the stock is delisted because of ineligibility. Once a stock has been replaced, the divisor is reviewed and modified to ensure a seamless transition of the Nikkei. 
Components of the Nikkei:
• As of May of 2011, the Nikkei 225 consists of various (typically market leading) Food, Automotive, Precision Instruments, Textiles & Apparel , Manufacturing, Pulp & Paper, Construction, Mining, Chemical, Trading, Pharmaceutical, Retail, Oil & Coal, Banking, Glass & Ceramic, Rubber, Insurance, Nonferrous material, Financial, Steel, Real Estate, Security, Machinery, Marine Transport, Other Land Transport, Railway and Bus, Airline, Electric Power, Electric Machinery, Warehousing, Communication, Shipbuilding, Service and Gas companies.